Expenditure
Total Expenditure
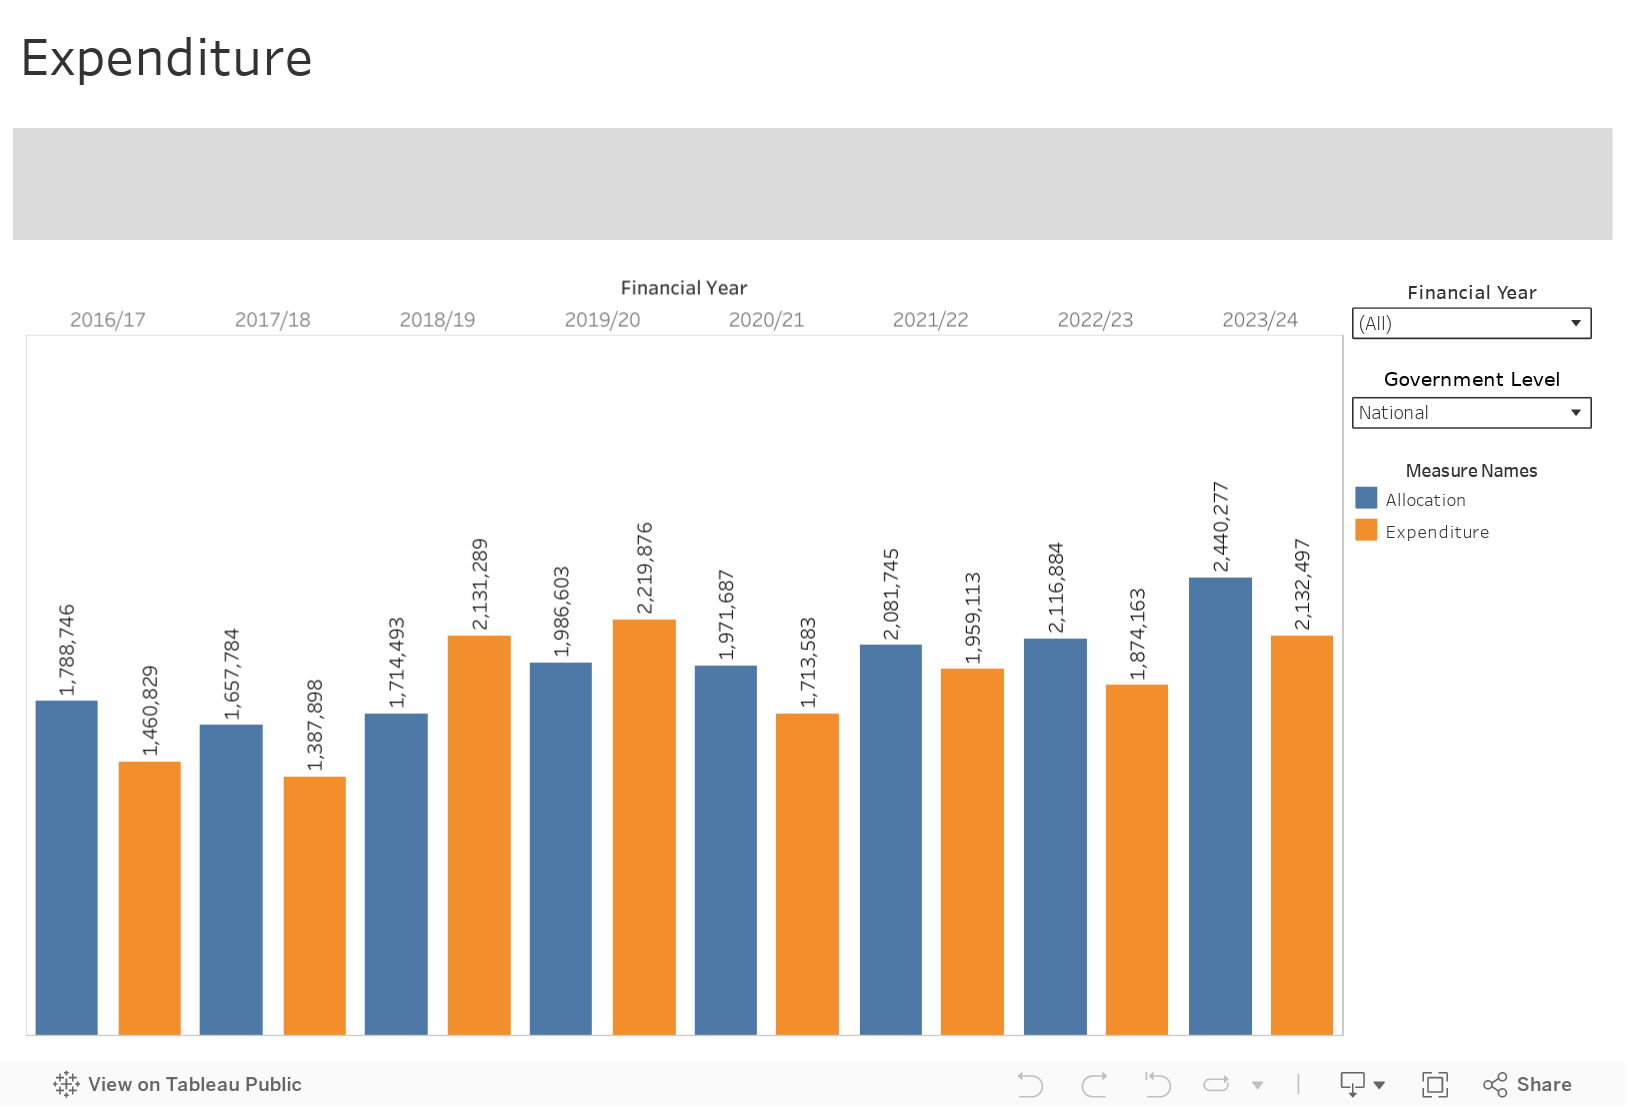
Kenya’s total FY 2023/24 budget hit KSh 3.0 trillion, but spending reached only KSh 2.58 trillion—about KSh 420 billion under plan
Total expenditure is the actual amount of money that both the national government and the 47 counties spend in a financial year. This includes payments like salaries for teachers, road construction, and debt repayments. It’s compared to what Parliament and county assemblies had approved in the budget (the planned amount).
In the 2023/24 financial year, Kenya had budgeted to spend KSh 3.0 trillion. But the government actually spent only KSh 2.58 trillion — which means it spent KSh 420 billion less than planned.
Looking at the years from 2016/17 to 2023/24, the budget kept growing — from about KSh 2.19 trillion to KSh 3.00 trillion. Actual spending also increased over time — from KSh 1.78 trillion to KSh 2.58 trillion — but it was usually below what had been budgeted.
In the first few years, the government consistently spent less than planned, with gaps ranging from KSh 220 to 410 billion. This was mostly because projects took time to start and revenues were lower than expected.
The only year the government spent more than planned was 2019/20. That year, spending hit KSh 2.60 trillion, about KSh 110 billion over the KSh 2.49 trillion target — driven by late stimulus efforts and major infrastructure bills.
Since then, spending has again stayed under the budget. In 2023/24, the government spent KSh 420 billion less than planned. Spending less means borrowing less, but it can also slow down projects and delay payments.
How to explore it
Use the “Government Level” filter to switch from Total to National or County. That lets you see which tier sticks closer to its budget and whether the spending gaps you see here are driven more by the national ministries or the county governments.
Recurrent Expenditure
Kenya’s recurrent budget reached KSh 2.10 trillion in FY 2023/24, yet actual day-to-day spending was about KSh 150 billion lower.
Recurrent expenditure is the money government uses to keep daily services running. It covers things like salaries and pensions for public workers, office water and electricity bills, regular maintenance, and interest on loans. It’s different from development spending, which goes toward building new things like roads or hospitals.
In the 2023/24 financial year, Kenya had set aside KSh 2.10 trillion for recurrent expenses. But it ended up spending about KSh 1.95 trillion — around KSh 150 billion less than planned.
Between 2016/17 and 2023/24, the recurrent budget nearly doubled — from KSh 1.17 trillion to KSh 2.10 trillion. Actual spending also went up — from KSh 1.07 trillion to KSh 1.95 trillion — but it was usually a bit below what was budgeted. The closest match was in 2017/18, when nearly the full amount was spent.
Since then, the gap has grown again. In the most recent year, about KSh 150 billion wasn’t spent. While this helps reduce borrowing, it may also mean delayed salaries, unpaid bills, or slowed maintenance — showing how the government has to balance between rising costs and limited funds.

Development Expenditure
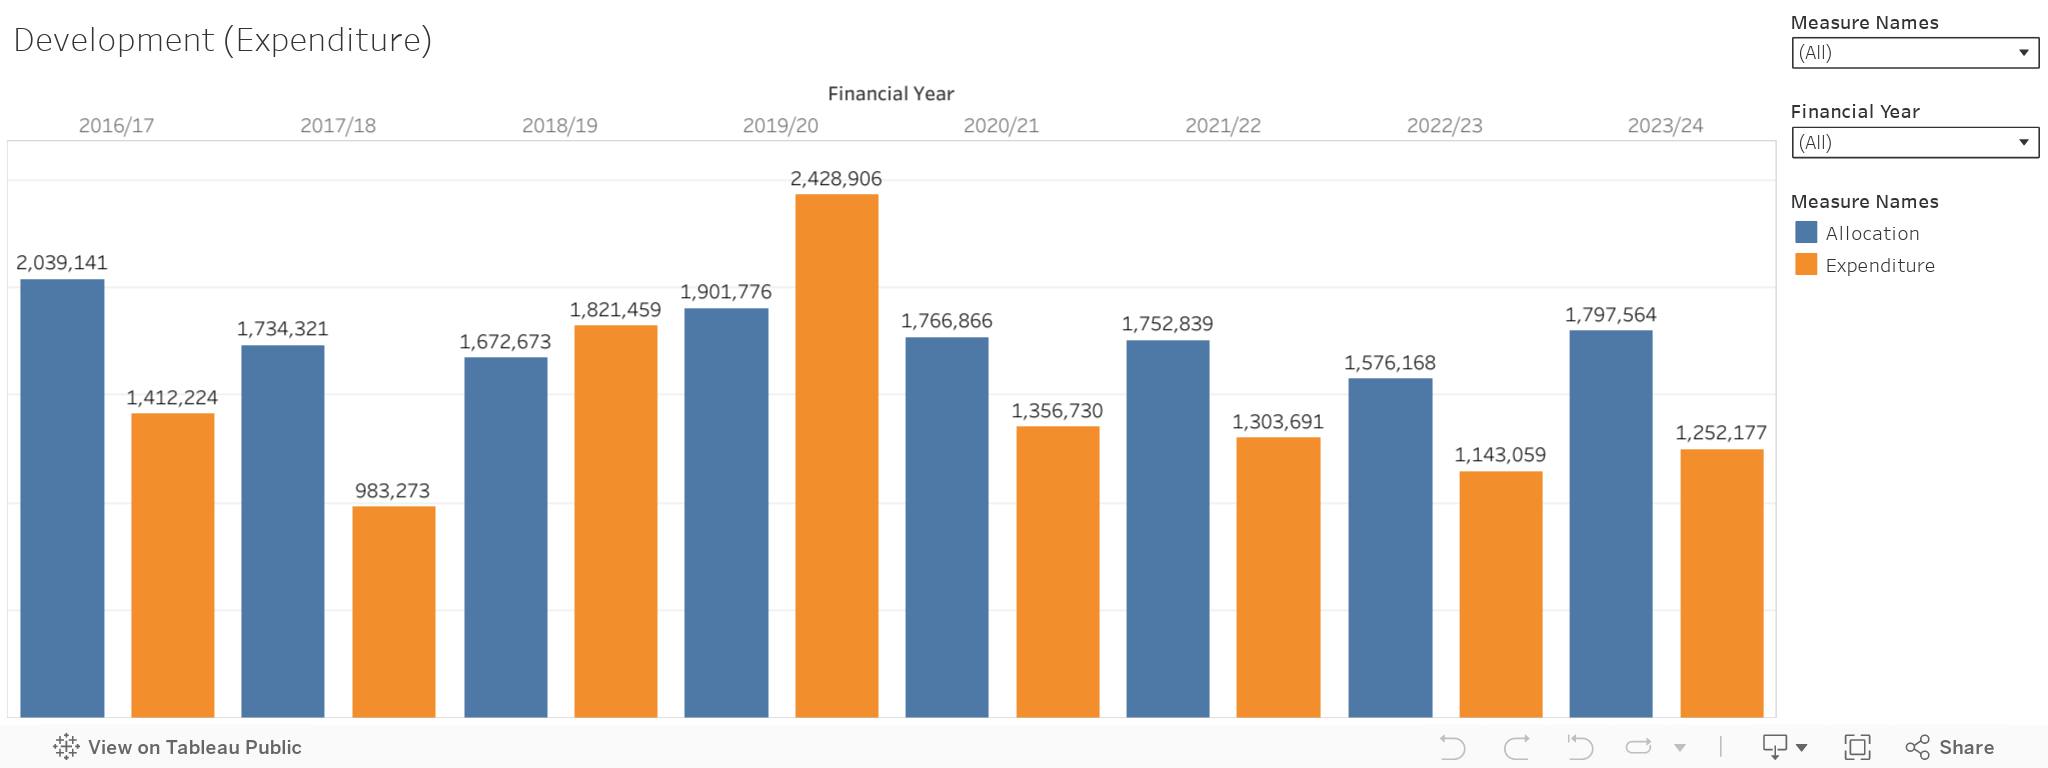
Kenya’s FY 2023/24 development budget was KSh 0.90 trillion, but only KSh 0.63 trillion was spent—about KSh 270 billion left unused
Development expenditure is the money government uses for long-term projects — like building roads, dams, schools, and hospitals. These are large, one-time investments that are different from daily costs like salaries or electricity bills.
In the 2023/24 financial year, Kenya planned to spend KSh 900 billion on development, but only KSh 630 billion was actually used. That means about KSh 270 billion went unspent.
From 2016/17 to 2023/24, the development budget dropped slightly — from around KSh 1.02 trillion to KSh 900 billion. Actual spending also went down — from about KSh 710 billion to KSh 630 billion. In most years, spending was well below what had been planned.
In five of the eight years, between KSh 200 and 400 billion of development funds were left unused.
One year stood out — 2019/20. That year, development spending rose to KSh 1.21 trillion, which was about KSh 260 billion above the budget. After that, spending dropped again.
In 2023/24, the gap between the budget and actual spending widened once more.