Debt
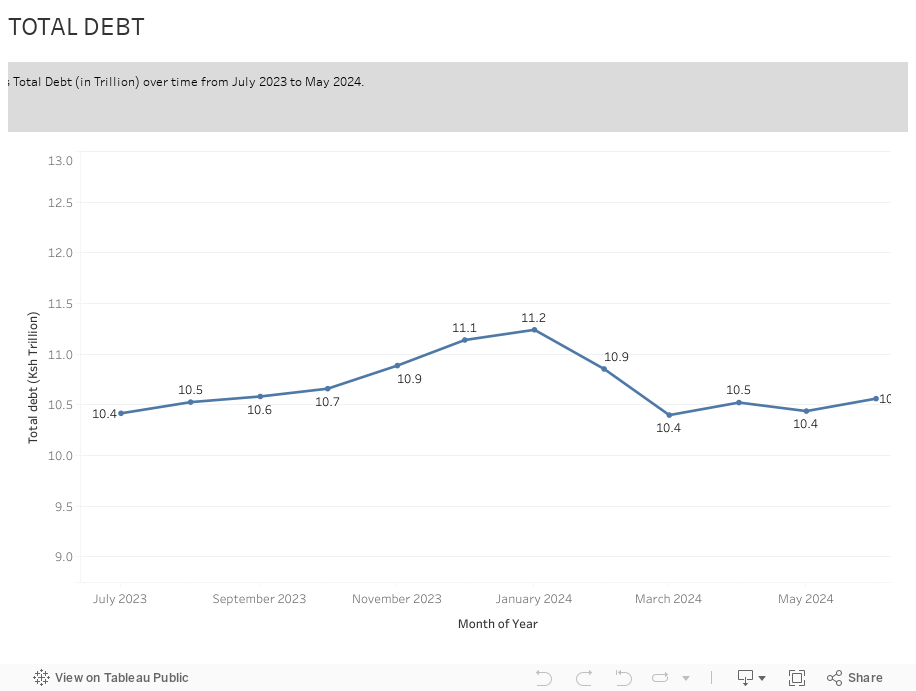
Kenya’s total debt peaked at KSh 11.2 trillion in Jan 2024, dipped to KSh 10.4 trillion in Apr, and edged back up to about KSh 10.9 trillion by Dec 2024.
Total debt is the full amount the national government owes. This includes treasury bonds and bills, loans from other countries or international banks, and any borrowing from the Central Bank. You can think of it like Kenya’s national credit card balance — tracked at the end of each month.
In January 2024, Kenya’s debt reached a high of KSh 11.2 trillion. By April, it had dropped to KSh 10.4 trillion. Then by December 2024, it had risen again to around KSh 10.9 trillion.
Between July 2023 and December 2024, the debt changed in three clear phases:
From July 2023 to January 2024, it went up steadily — from KSh 10.4 trillion to KSh 11.2 trillion.
From February 2024 to March 2024, it dropped sharply — back down to KSh 10.4 trillion.
From May 2024 to December 2024, it slowly rose again — ending the year at about KSh 10.9 trillion.
This up-and-down pattern shows that Kenya’s debt levels change not only because of new borrowing, but also due to other short-term factors.
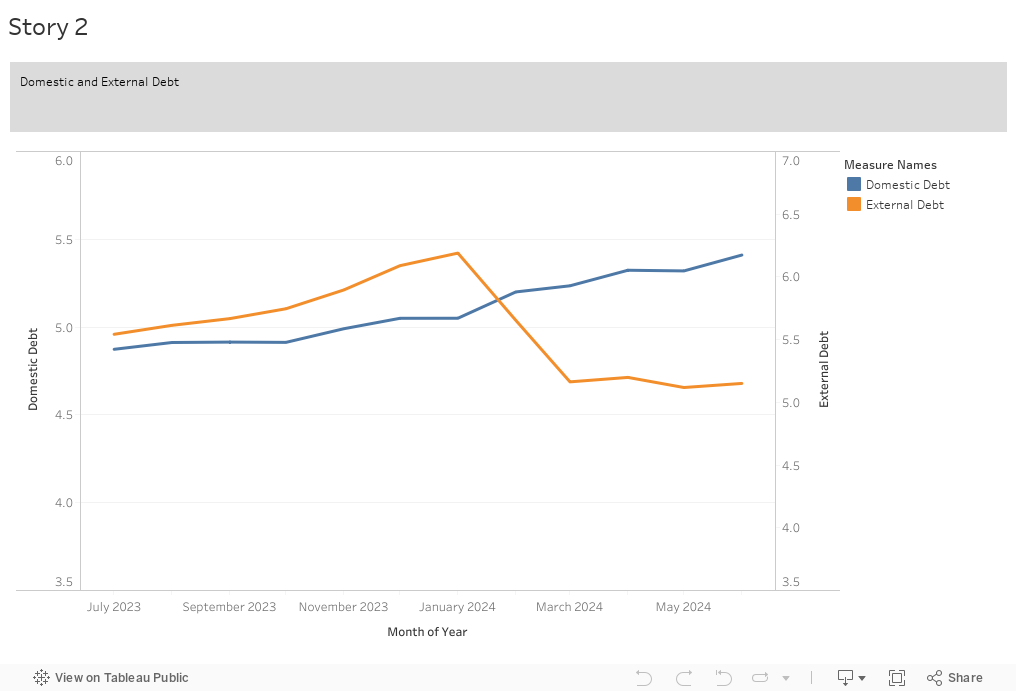
Domestic and External Debt
The chart shows trends in Domestic and External Debt (in trillions) over time. Domestic debt steadily increases, while external debt initially rises, peaks around early 2024, then drops sharply before stabilizing. This suggests a possible shift towards domestic borrowing or external debt repayment. The stabilization indicates controlled borrowing after the decline. Key questions include the reason for the external debt drop and whether policy changes influenced the trend.
Debt Service
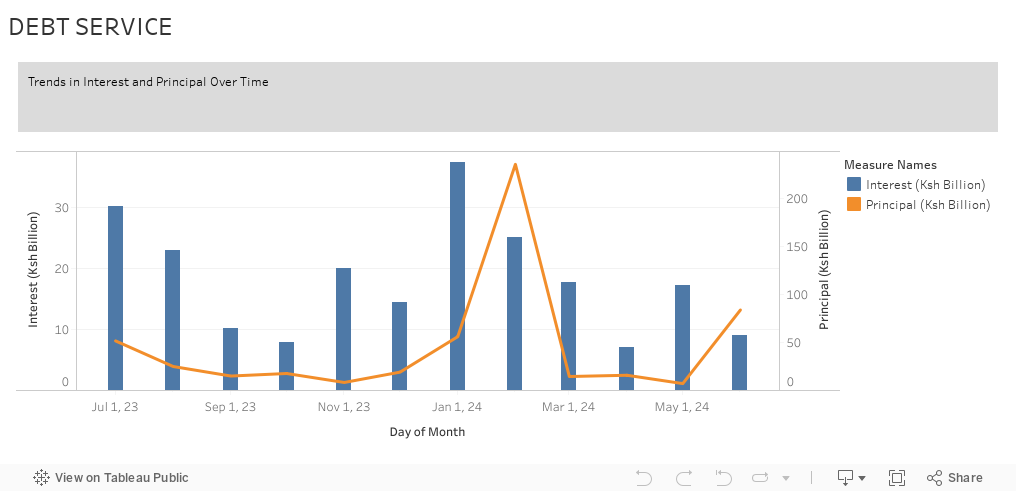
Debt service is the money Kenya pays each month on its loans. It has two parts: interest, which is the fee for borrowing, and principal, which is the amount of the loan being repaid.
From July 2023 to September 2024, interest stayed fairly even. It moved within a band of about KSh 7 billion to KSh 37 billion, starting at KSh 30.08 billion in July 2023, dipping to KSh 6.96 billion in April 2024, and ending at KSh 16.27 billion in September 2024.
Principal shifted much more. Smaller payments showed up in November 2023 (KSh 8.36 billion), October 2023 (KSh 17.71 billion), and March 2024 (KSh 14.57 billion). Large spikes came in January 2024 (KSh 56.09 billion), February 2024 (KSh 235.74 billion), and June 2024 (KSh 83.94 billion). After those peaks, principal fell to KSh 49.98 billion in July 2024 and KSh 22.17 billion in September 2024.
So, while interest shows a steady monthly rhythm, principal jumps up and down with occasional big payments.